Data Visualization
In an ideal world, data visualizations, infographics, and other types of visualizations empower people with information clearly and truthfully; however, the reverse often happens. With this project, we wish to gain a deeper understanding of when and how visualizations of data mislead. By determining and testing different visual features, we hope to help designers base their choices on scientific evidence and thus avoid the misinformation of audiences.
The project is part of a larger data visualization project called Visualizing Sustainability, funded by RDA. Pia Pedersen manages the project in collaboration with Chiron Oderkerk, Susanne Mariska van den Heuvel, and Elias Stenalt Werner, an interdisciplinary team consisting of graphic designers and researchers within information design and cognitive psychology.
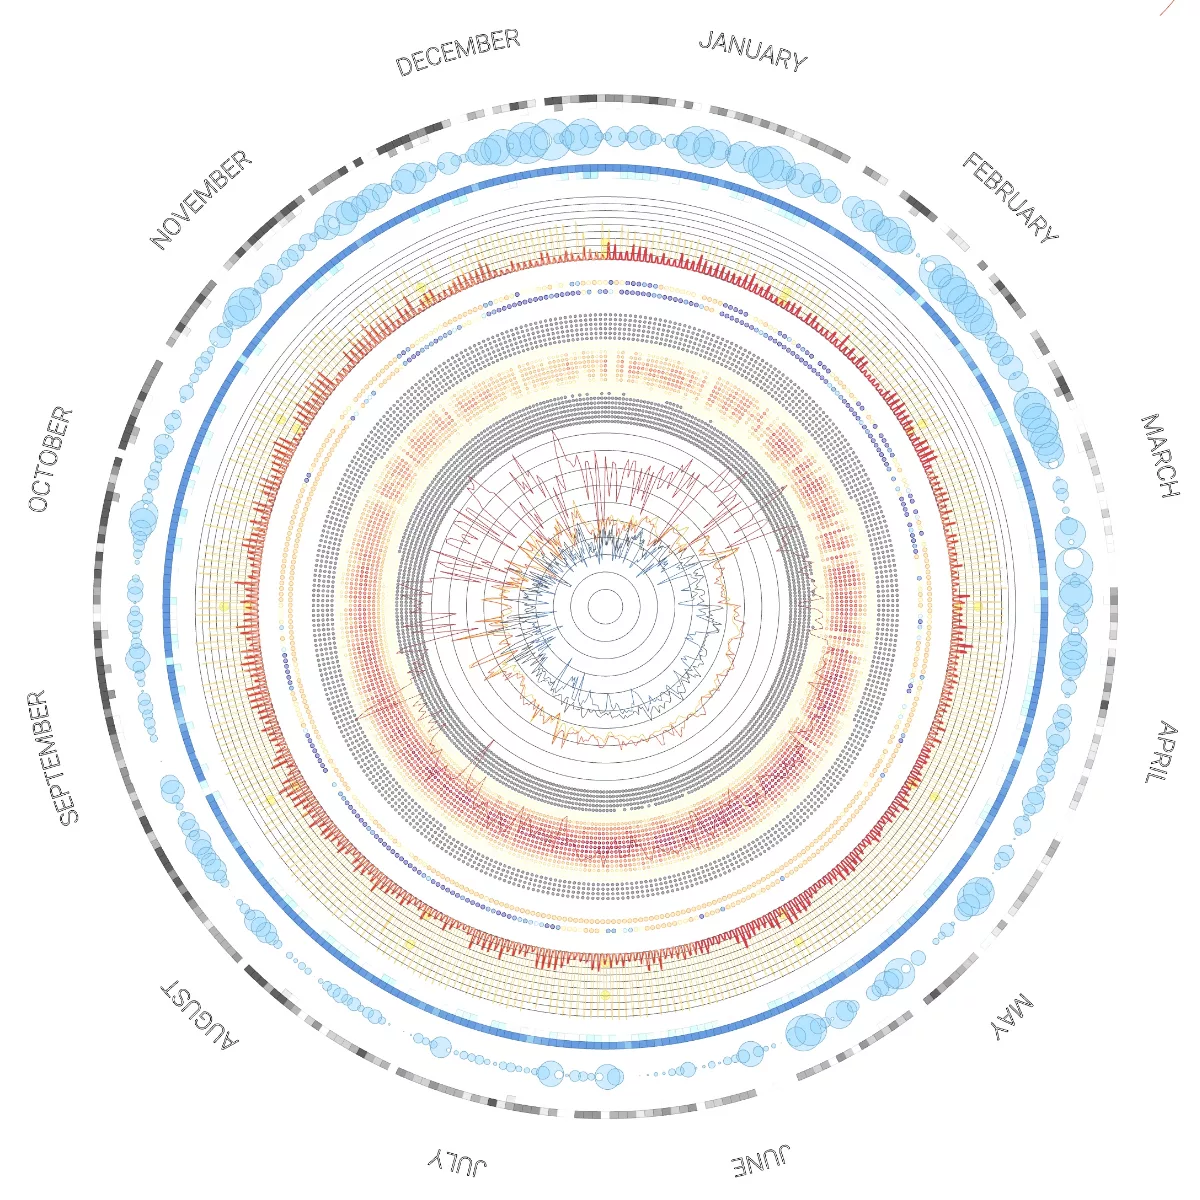
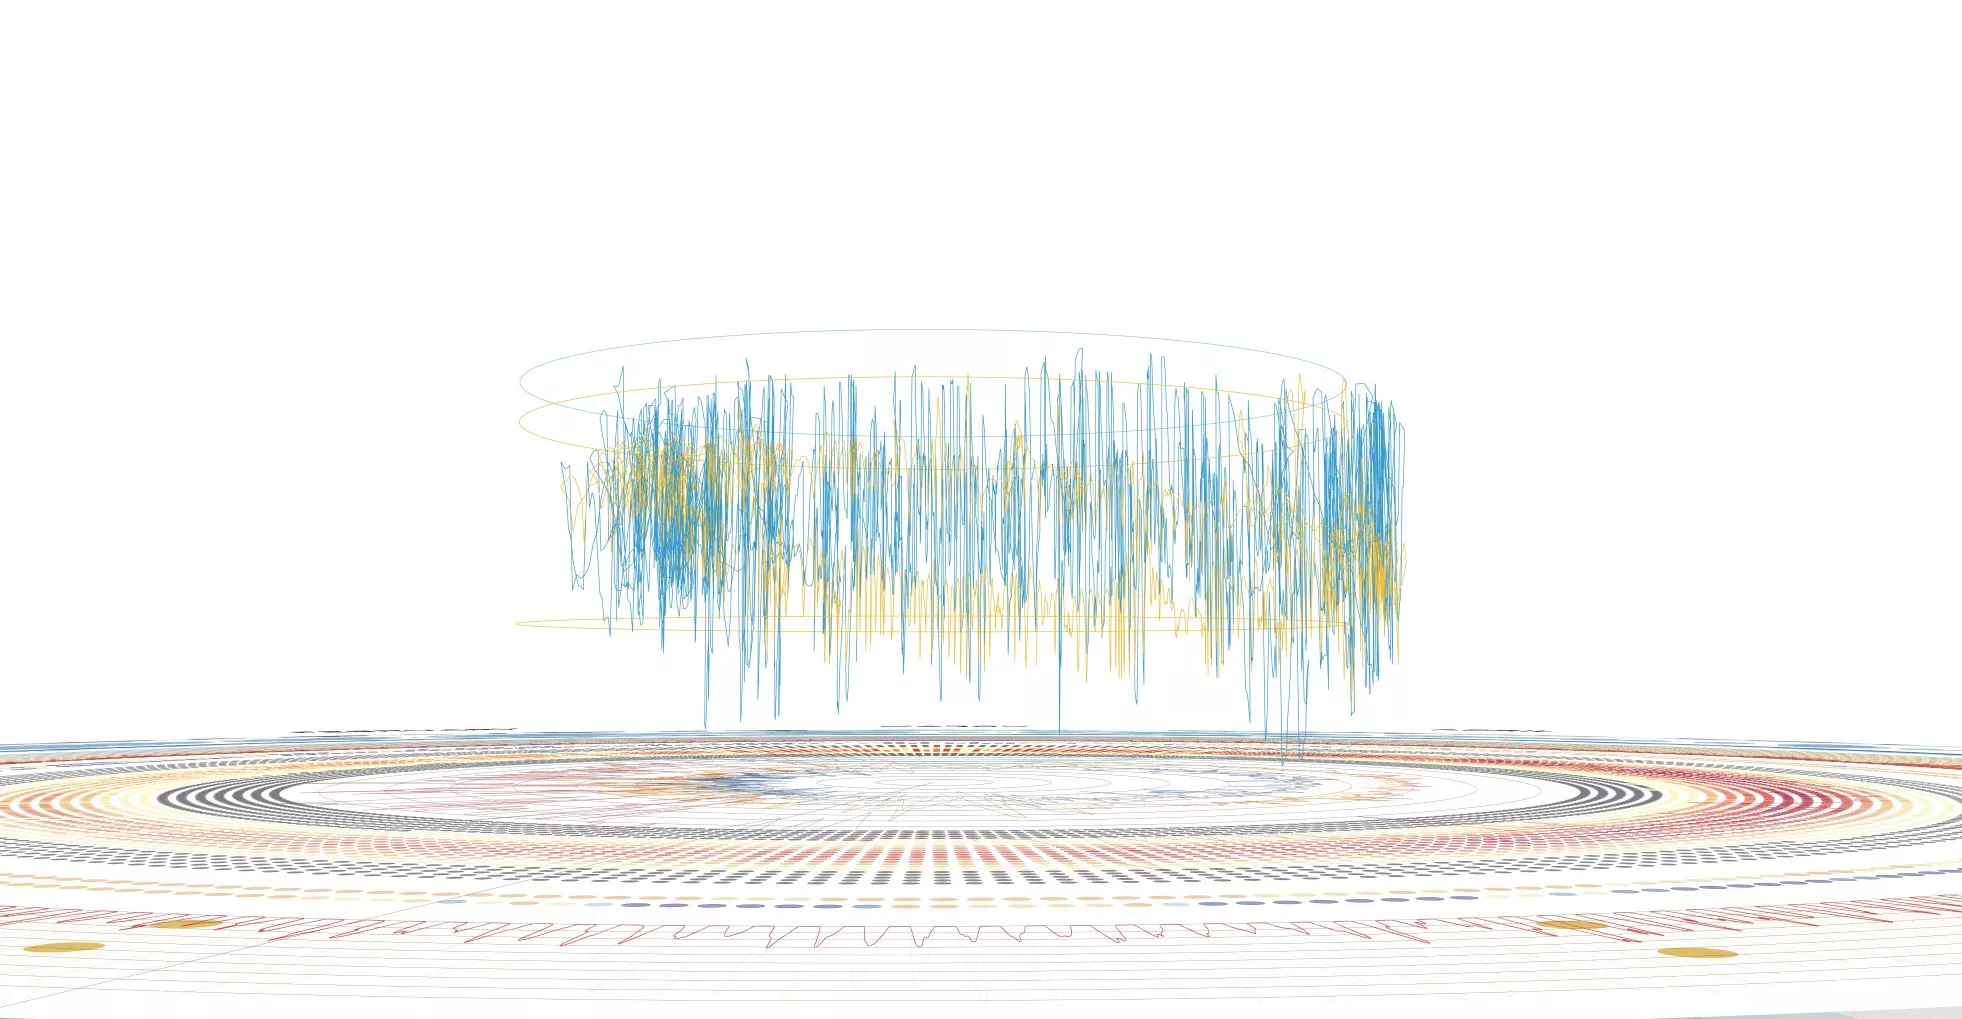
Site-specific Environmental and Performance Data Visualization in 2D and 3D
The initial stage of the project has focused on translating a printed reference to an interactive space, experimenting with combining temporal and spatial data sets into a series of interactive modes of different complexity. Going forward the focus will now be on developing an interface to allow the user to curate the graphic adjusting colours, scales and prioritising specific metrics. This stage will also include more detailed study of the graphic expression both in the interactive and printed output.
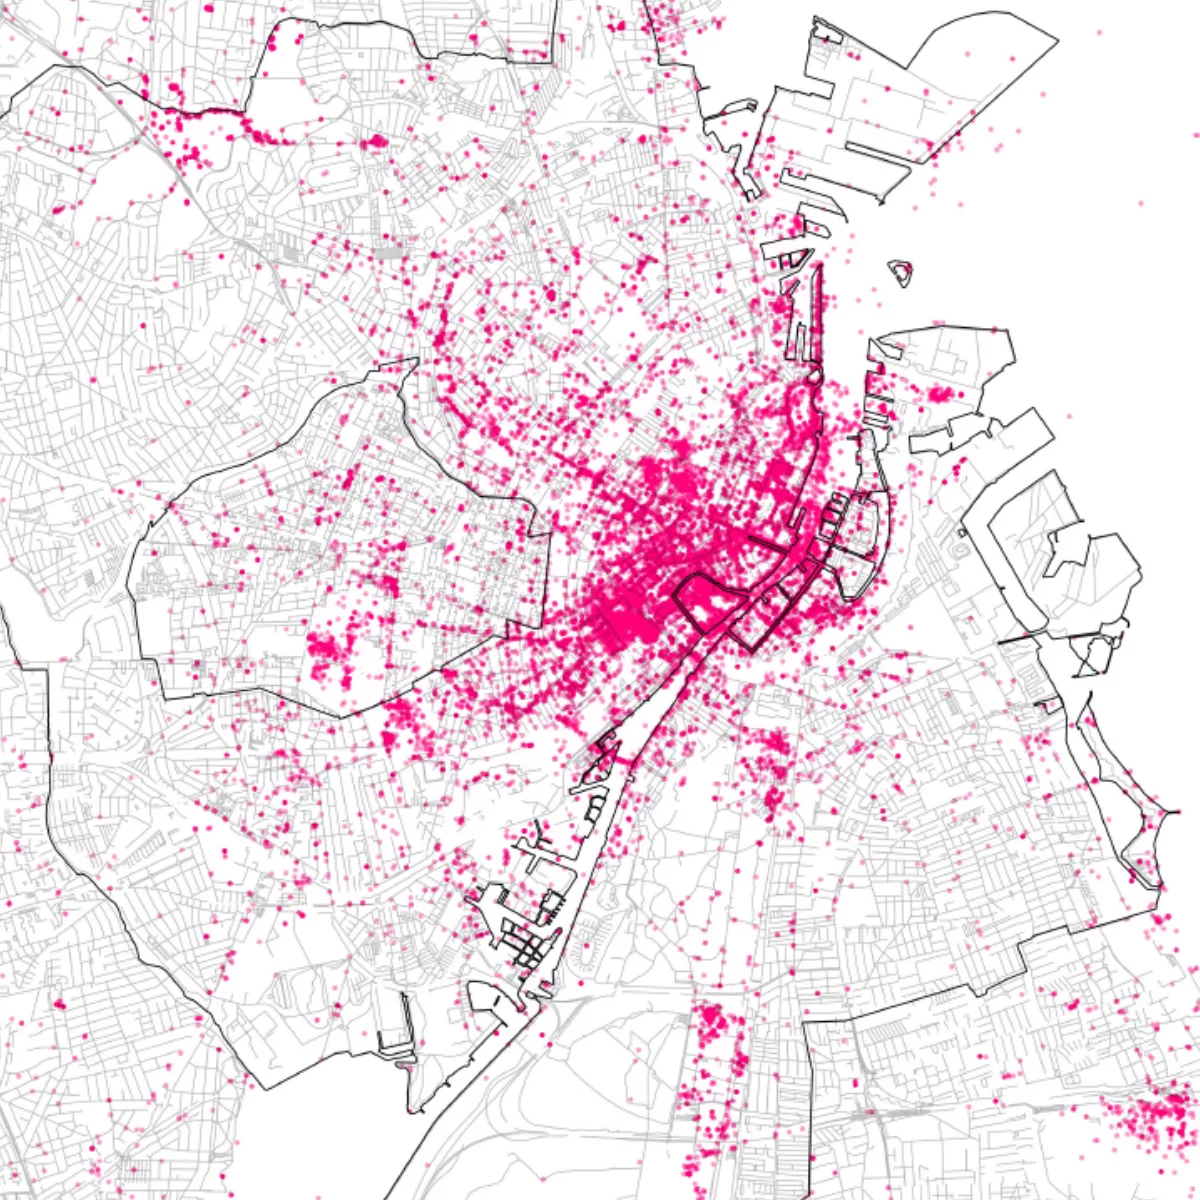
Mapping Urban Density for Sustainable Development in Copenhagen
A project concerning the density of points of interest in Copenhagen. Visualizing this data leads to a better understanding of sustainable urban development, both in the past and future
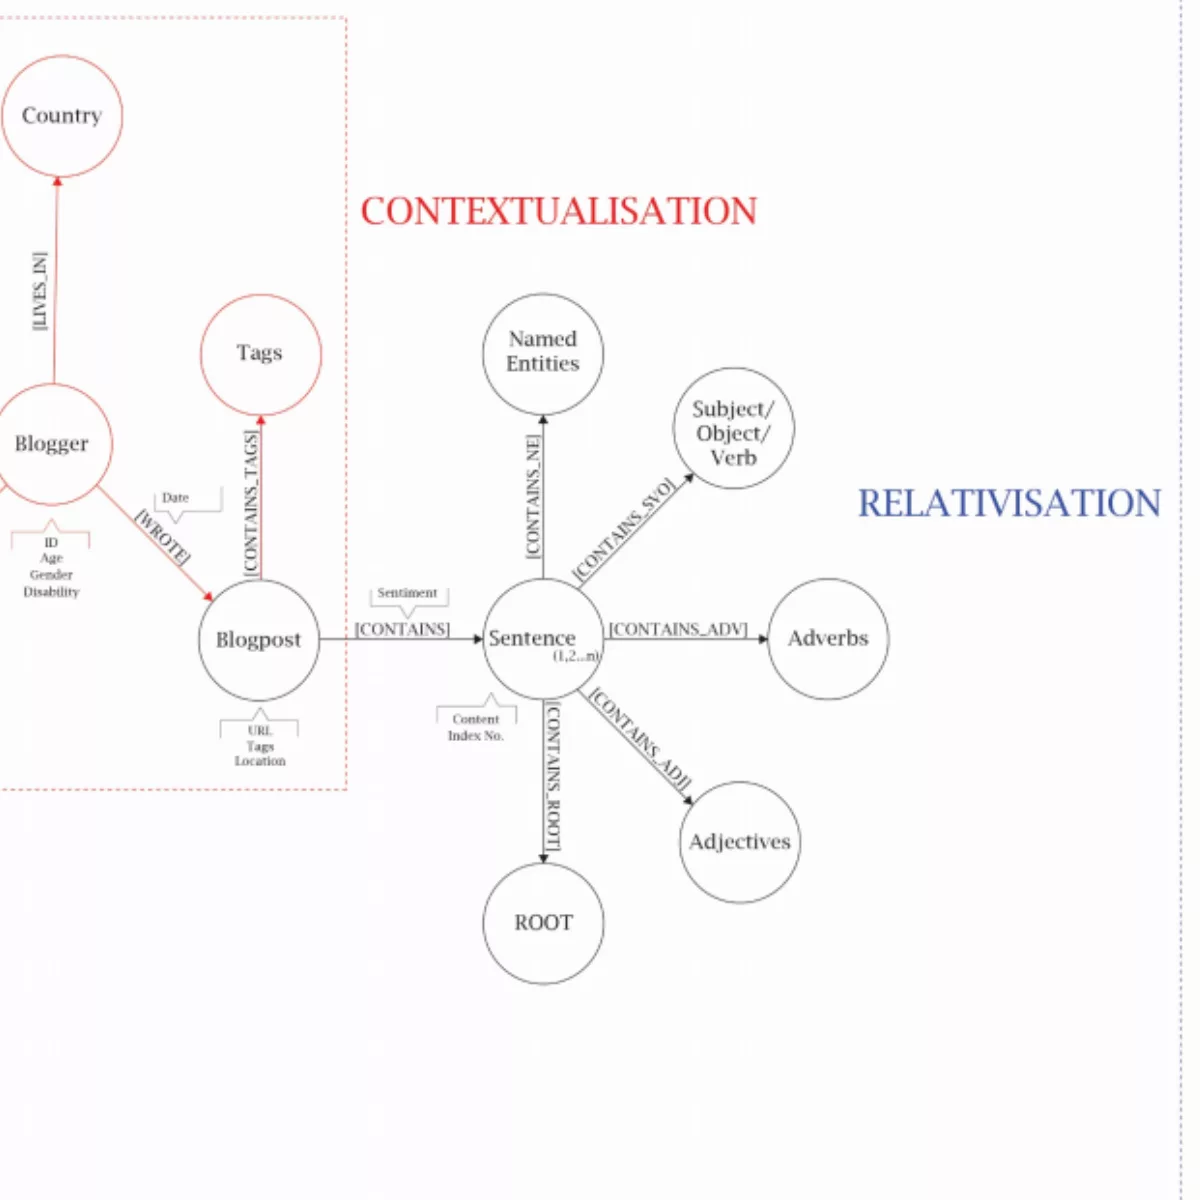
The missing voice of disable persons alternative guidelines on BR18
Using custom-made text mining tools, this project aims to provide a voice for the unheard, based on blog posts and web forums centered around disabled persons. The project provides visualizations of these voices that can be put to use when trying to provide facilities and conveniences in future building regulations.
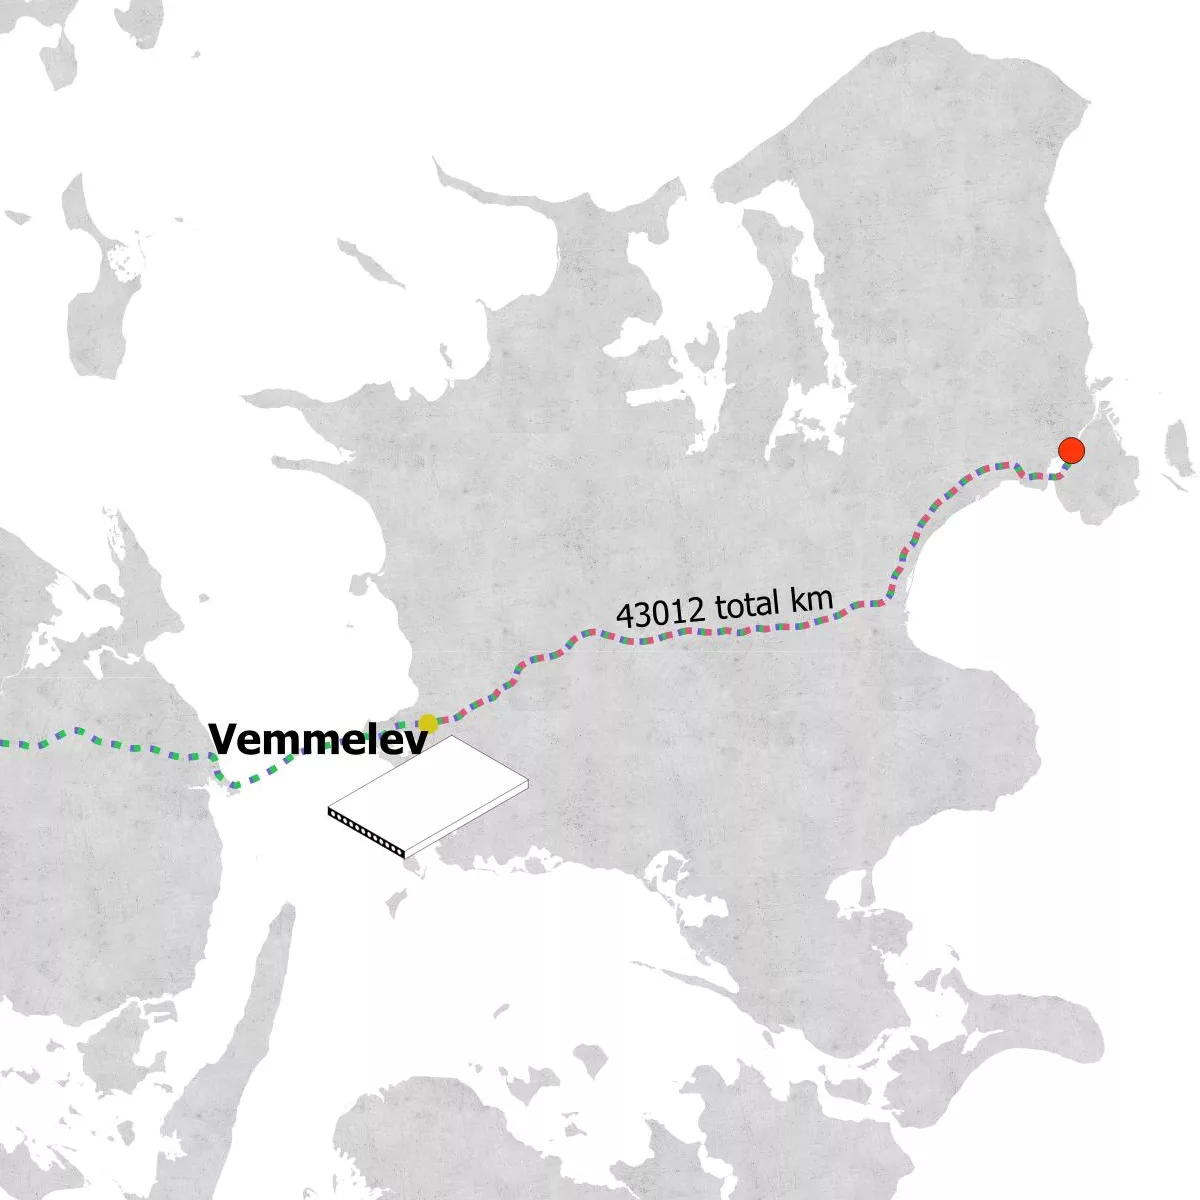
Mapping the Logistics of Building Materials
The process of mapping logistical costs tied to the building industry can lead to a better understanding of sustainable practices and how to implement them in future construction projects.
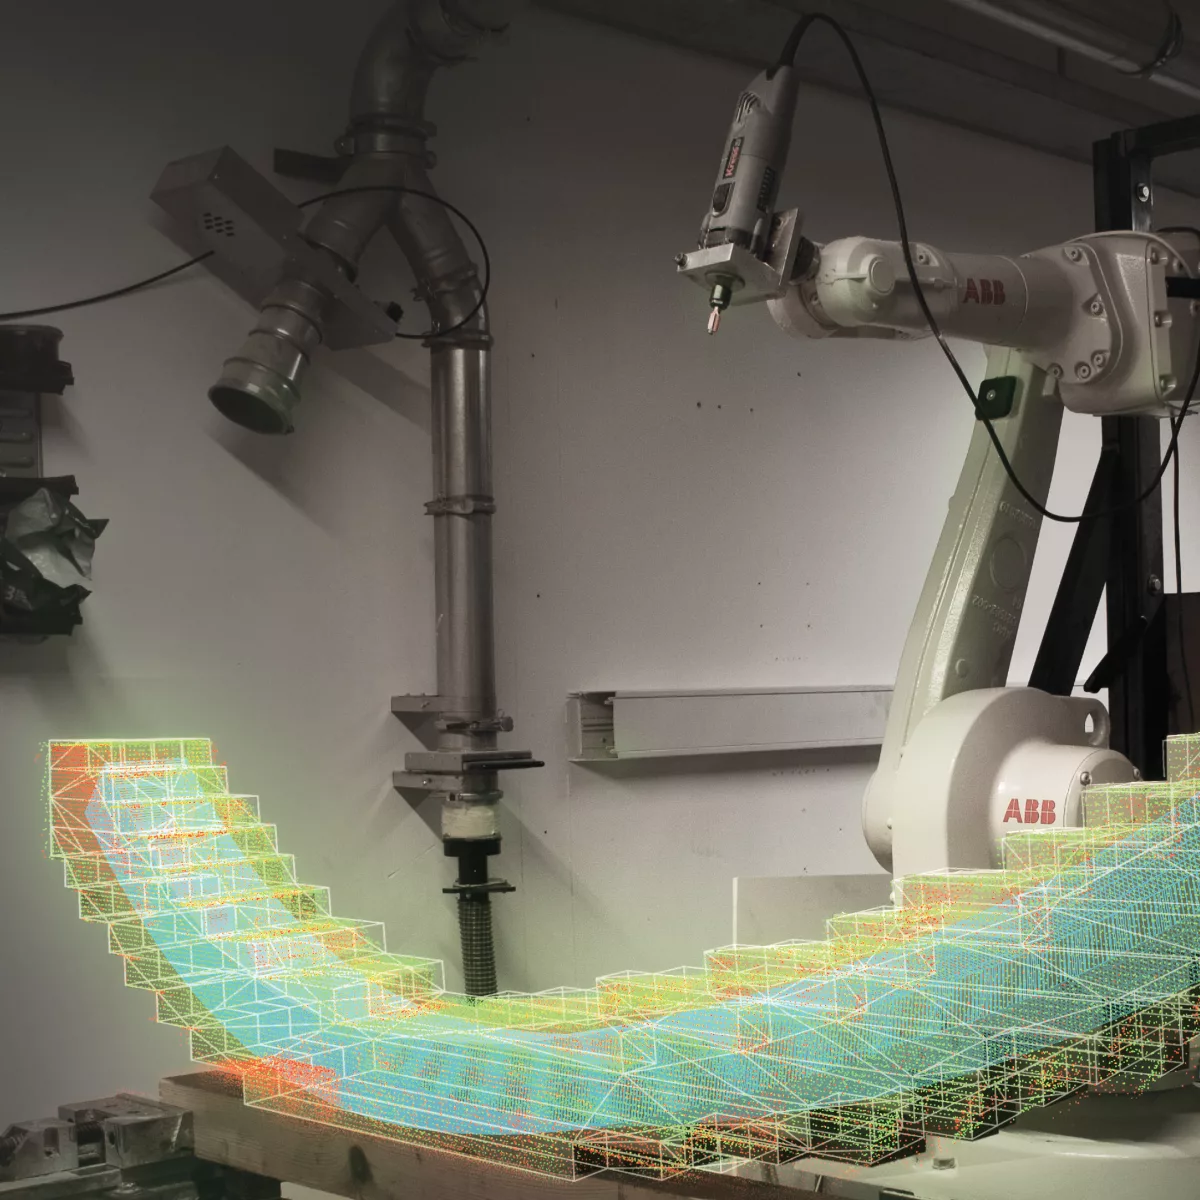
Deep Sight 3d visualisation of biomaterials for design
DeepSight seeks to develop design-focused visualisation techniques enabling designers to unintrusively gain understandings of the interior heterogeneous structure of familiar and emerging bio-materials.
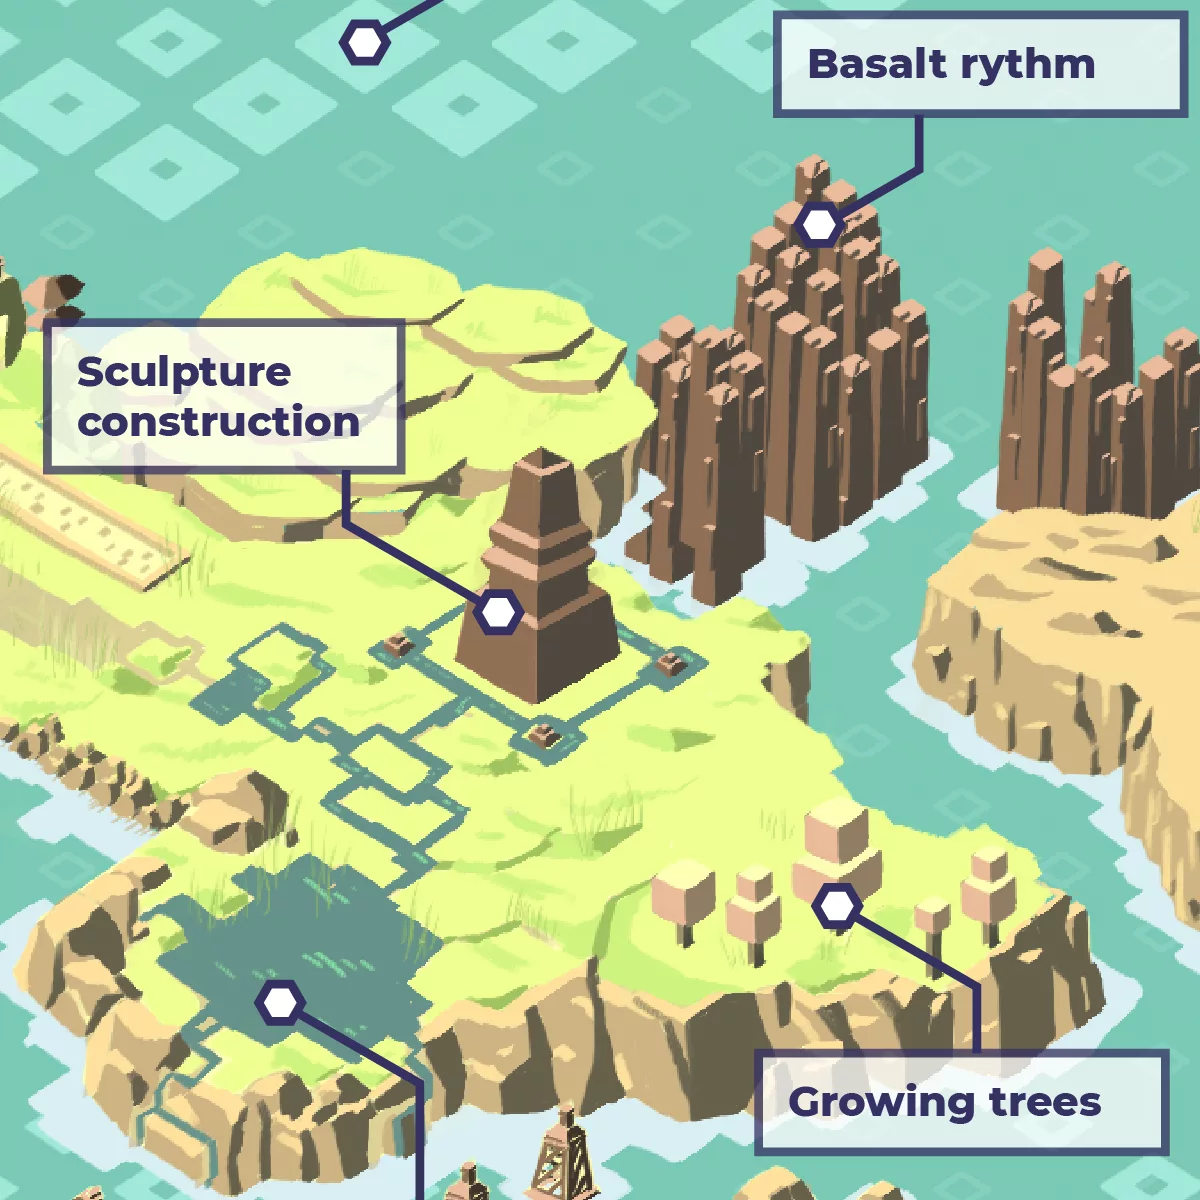
INTUIT – Visualizing simulated sustainable consumption
INTUIT/VISION explores the influence of an artistic product on users. The project consists of an interactive simulation, a visceral visualization, AI bots playing according to different agendas, and the evaluation of the simulation’s knowledge transfer potential.
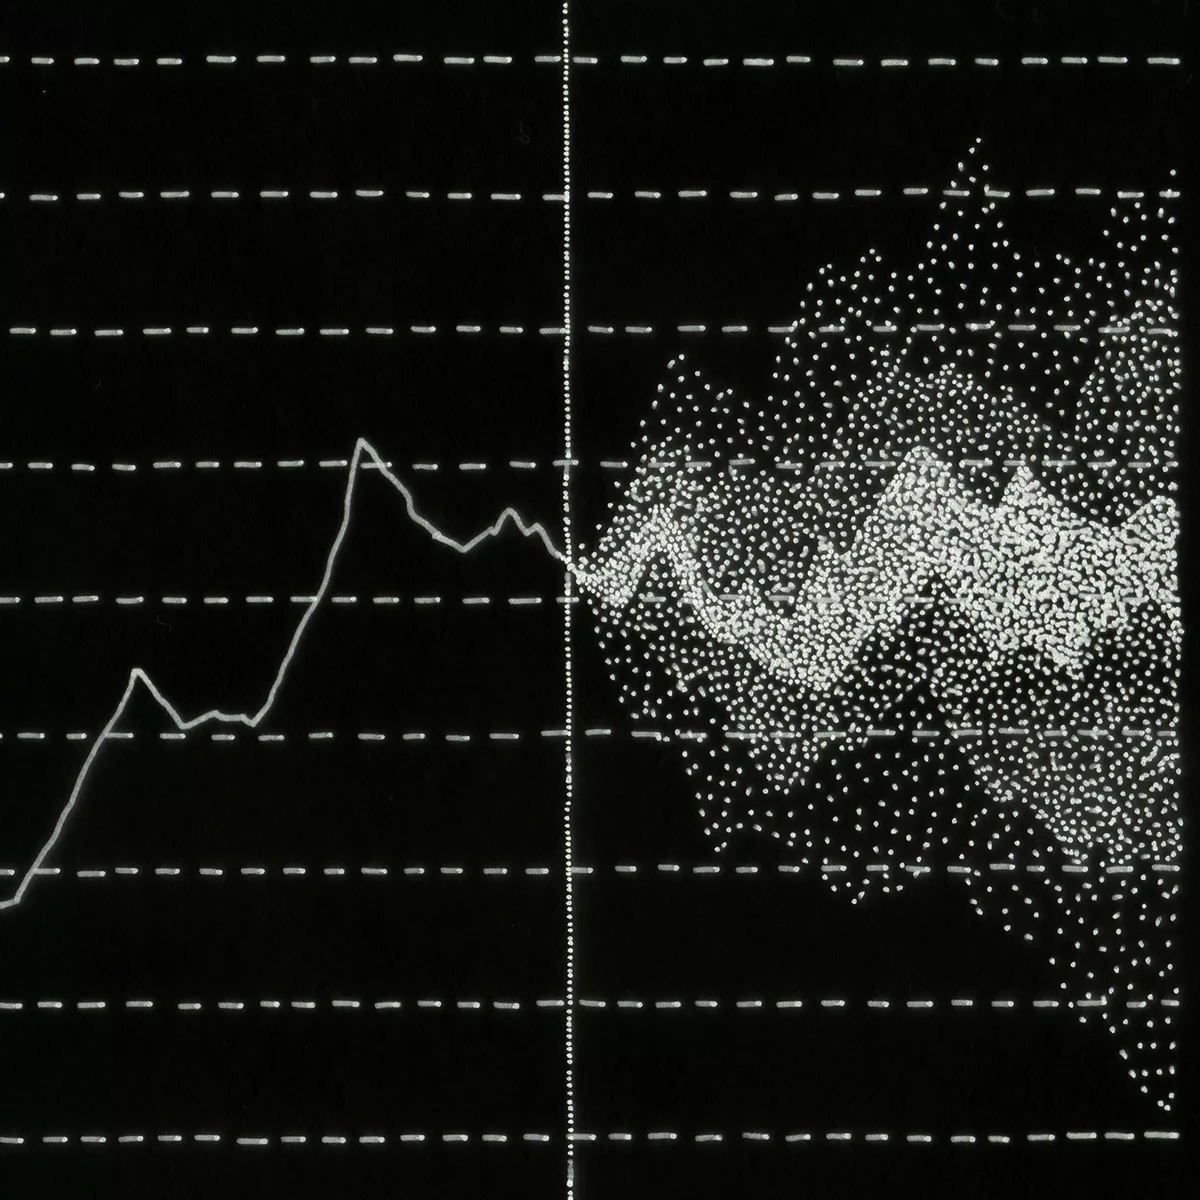
Connecting New Data Visualization Waves and Visualizing Sustainability
This project questions the objectivity of data visualization and examines which elements give data meaning and readers understanding. The aim is to improve the practice of data visualization and make designers stronger players in the field of data visuals.
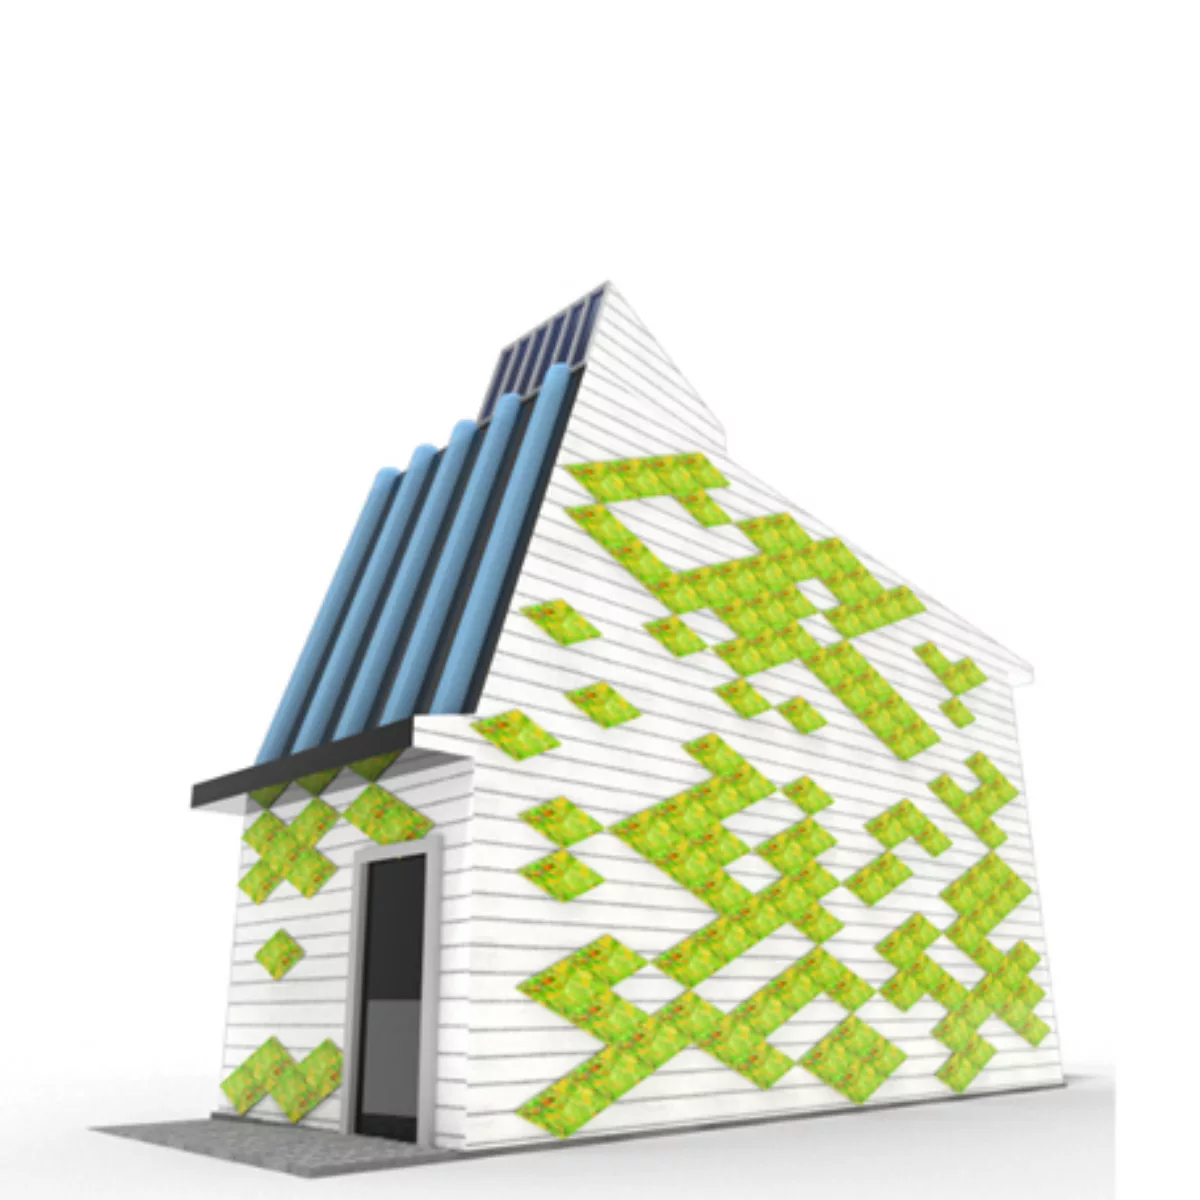
Imagining your sustainable home
This project explores data visualisation as a core creative and inspirational tool in the sustainability agenda. It asks how new data-driven machine learning practices could enable a non-specialist to creatively visualise and explore sustainable adjustments to their own homes.
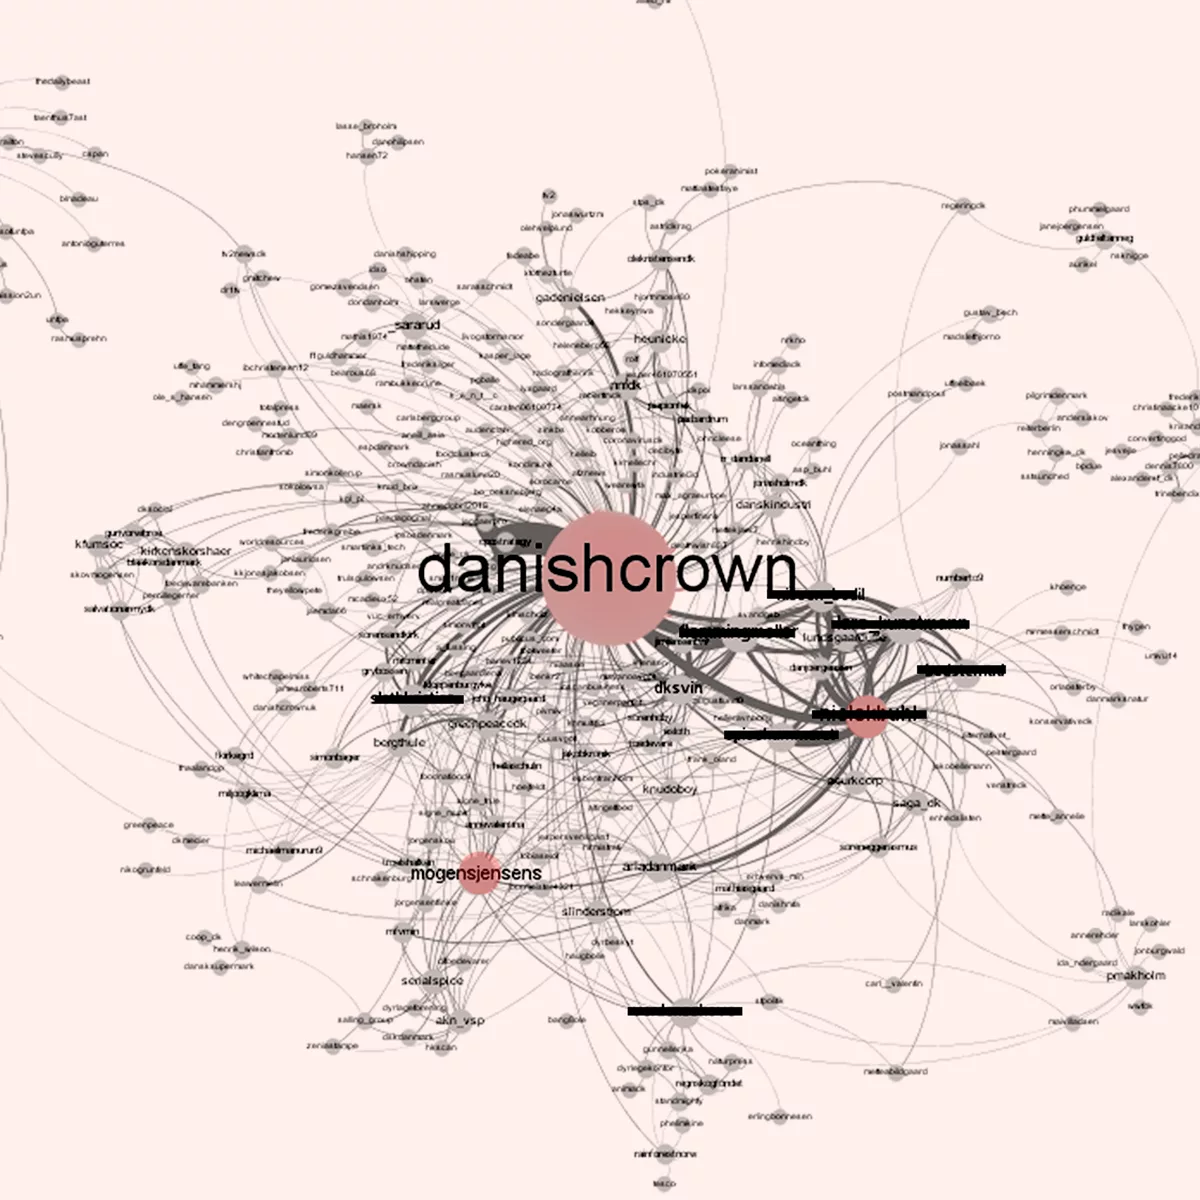
Actor network and spatial territorial impact mapping of Danish agri-food landscapes
This project investigates effective and novel approaches to analyzing and visualizing the socio-
spatial/territorial/network conditions of the Danish agri-food sector, with particular focus on the Danish
pig industry.

Architecture of Airs
This project introduces state of the art simulations of air in immersive architectural visualization, to encourage further development in designing with air flow as a core quality of 21st century architecture.
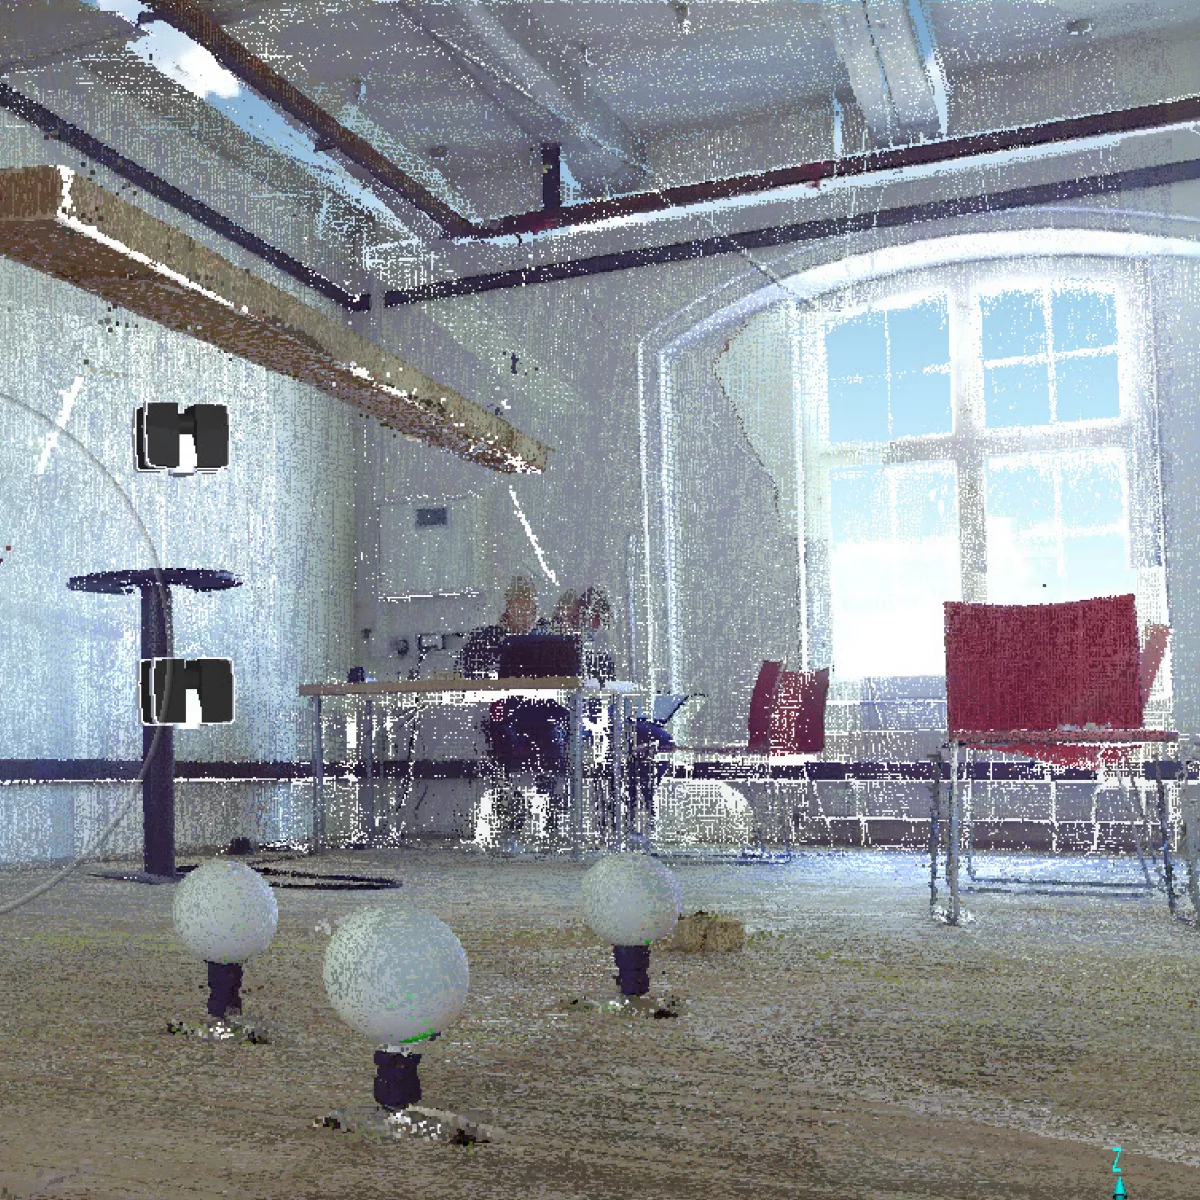
Wood sustainability Data visualisation beyond the sensory
Waste wood has incredible untapped potential as a building material and is anticipated to have much wider use in the future. Using photography, 3D scanning and rendering, this project creates a data visualization library of waste wood’s many properties and qualities.

Wicked Data Visualizing how data becomes data
Data visualization has become a powerful tool for scientists and researchers to explain data to a wider audience. This project aims to probe deeper inside the data systems that drive those visualizations and experiment with alternative for data representation