Connecting New Data Visualization Waves and Visualizing Sustainability
Project Authors
- Pia Pedersen, PhD – project leader.
- Chiron Oderkerk, postdoc.
- Susanne Mariska van den Heuvel, Research assistant
- Elias Stenalt Werner, Teaching associate professor
Description
We rely on data to inform our understanding and extrapolate our expectations in order to make crucial decisions for ourselves, others, and our shared future. Data visualizations, infographics or other types of visualizations, can help us do so by presenting the data accurately and truthfully.
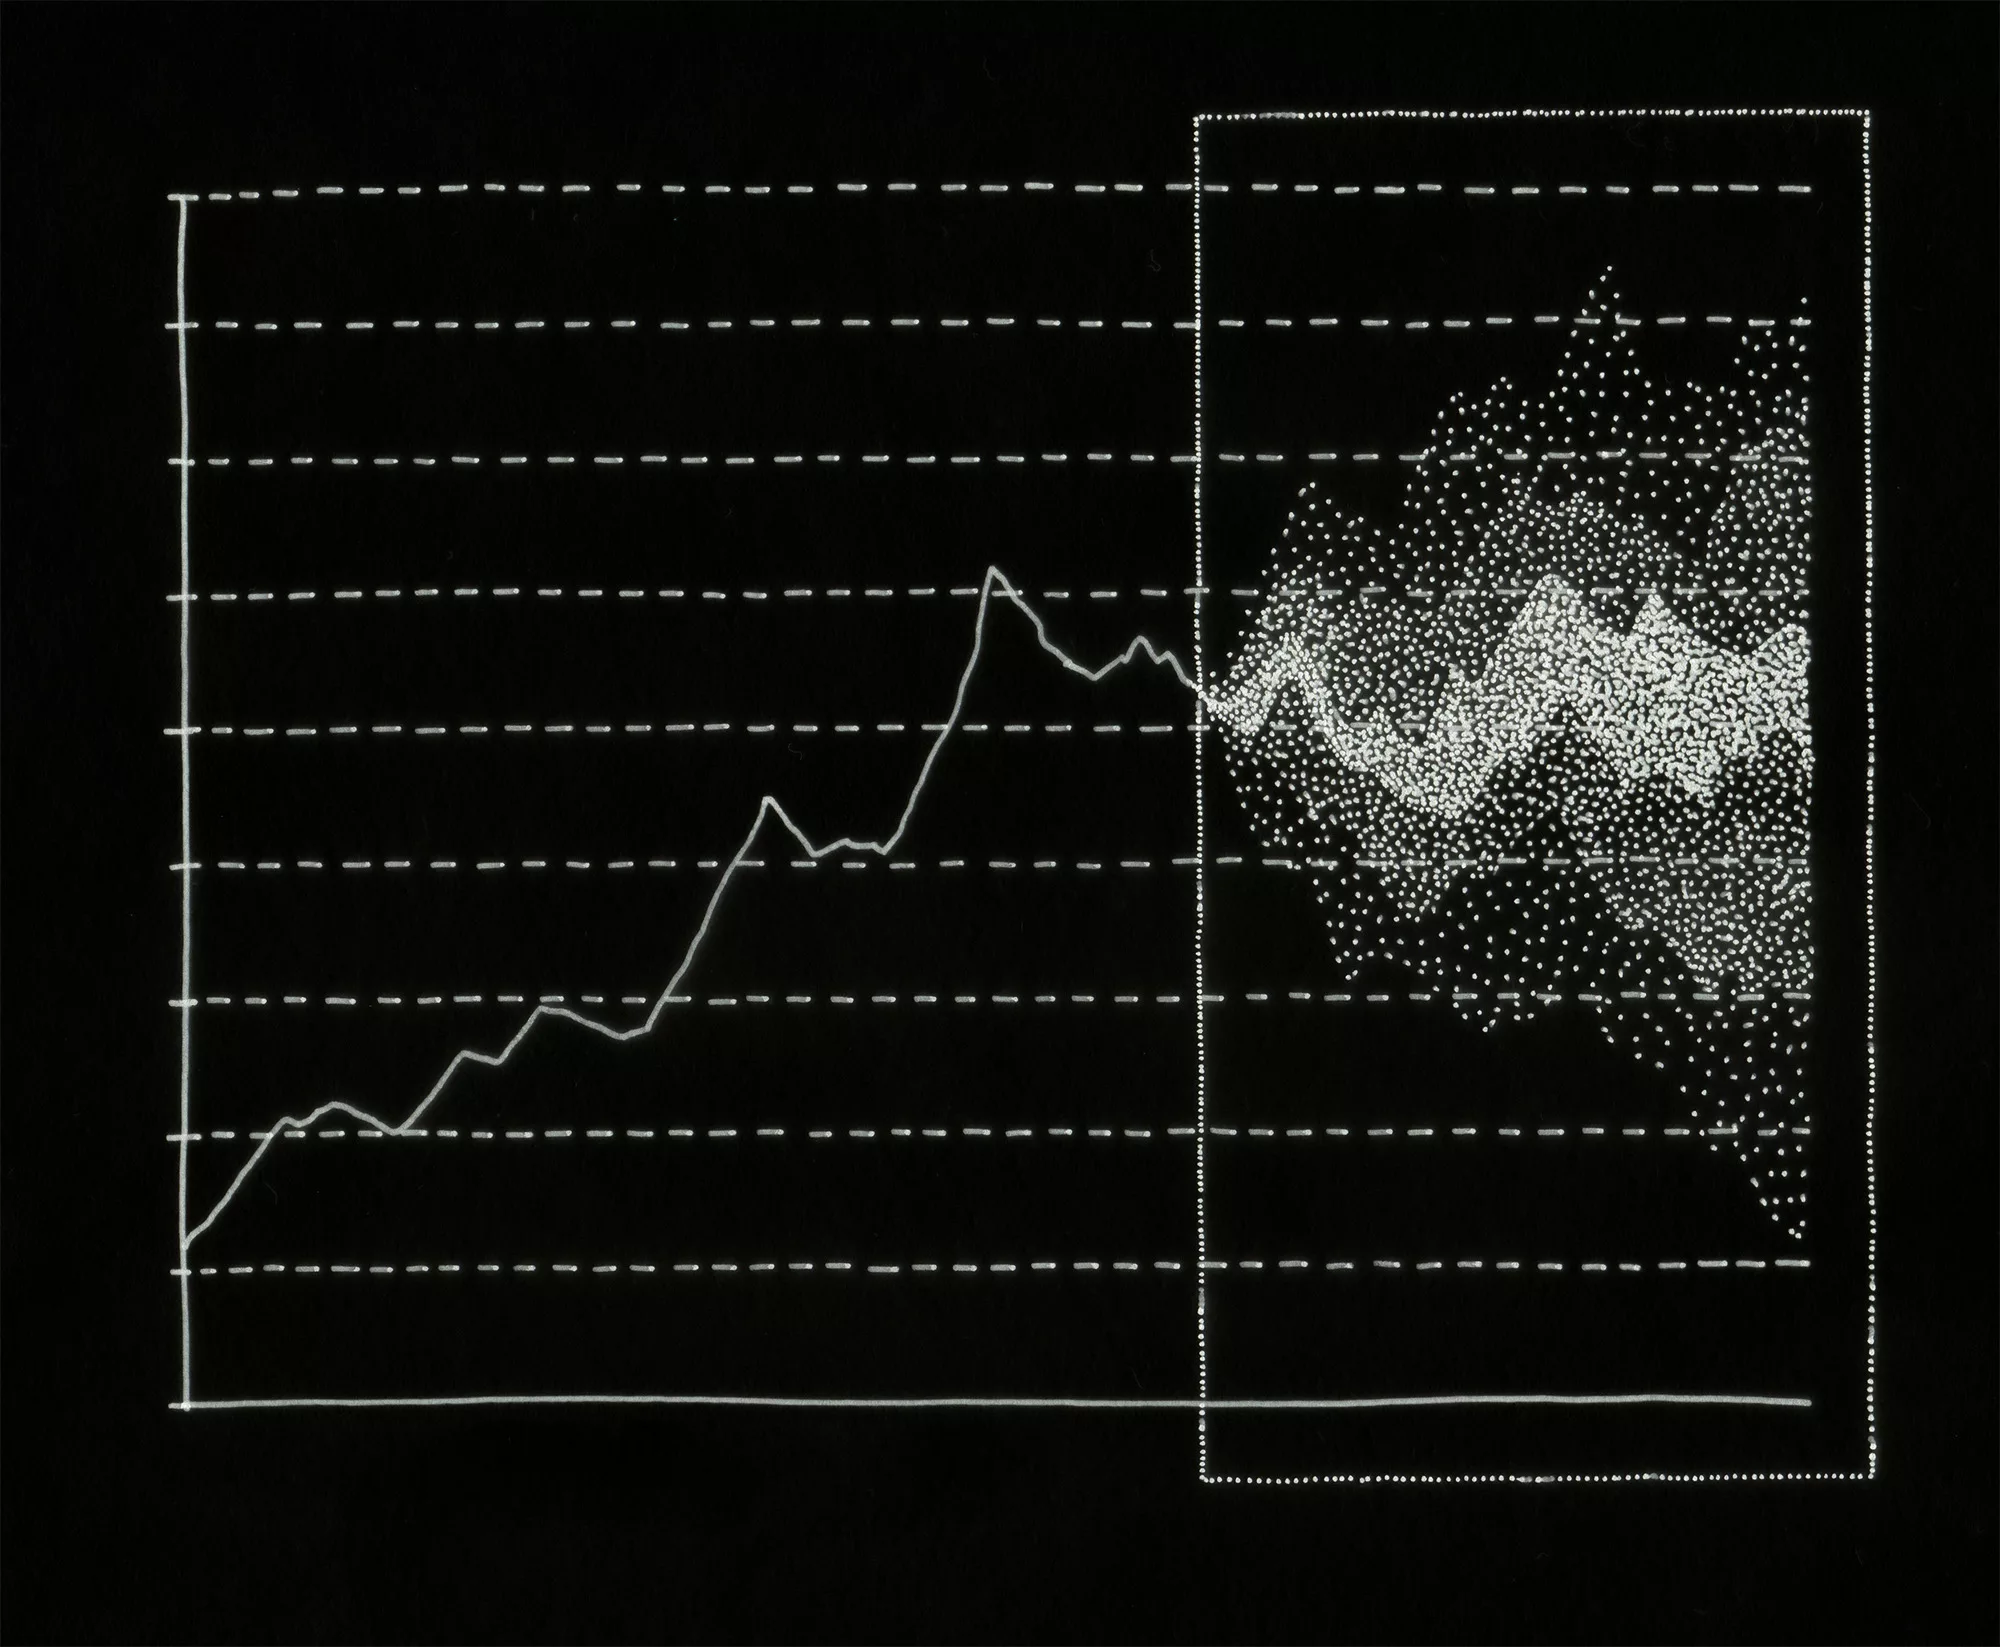
However, what if the two do not go hand in hand? What if truthfulness is about communicating uncertainties? What if visually distorting uncertain or obscure data, creates more truthful meanings? One might hope that by making the uncertainty inherent in data visually available, we would be able to make more informed decisions; nevertheless, the opposite tends to happen. When we see a data visualization, we want to interpret it as real evidence of the fact. If we are then presented with the multiplicities of data, they get in the way of our ability to make decisions.
Climate change data, the focal point of the current project, are filled with uncertainties that many of us find challenging to grasp and act upon. If we want to make use of visualized data effectively, we must understand how to embrace the uncertainties. Uncertainty is thus, a central aspect of data visualization. While the most common uncertainty visualizations are developed for scientific purposes, they are increasingly used to inform and influence the general public, for instance, for the communication of weather forecasts. However, we yet have to find the right approach, particularly for the broad audience.
With this project, we wish to question the sense of objectivity typically associated with data visualizations and examine what types of uncertainty visualizations may empower the reader to understand and act upon complex issues such as climate change. We will identify key design methods of visualizing uncertainty and conduct a pilot study to measure how different types of visualizations inform our actions. We hope to improve data visualization practice and make designers stronger players in the field of data visualization.